< Previous lesson | Overview | Next lesson >
DataPilot
How to manipulate huge amounts of data easily

This lesson is rather complex, compared to some of the other lessons, but itís not because itís difficult to understand! Itís just that itís more steps involved. I suggest that you read this lesson in two passes:
1. First just read, without trying it yourself (not just yet).
2. Then read it again, but then try out the example yourself.
This way you will get a pretty good overview of the concept. It’s not very hard, but if you try doing too many things at once, it can be more difficult than it has to be.
What is a DataPilot?
DataPilot is Calc’s way of letting you organize huge amounts of data in tables, yet enabling you to present it in a neat way. The way the data is displayed can easily be altered at any time. Look at the pictures below for examples:
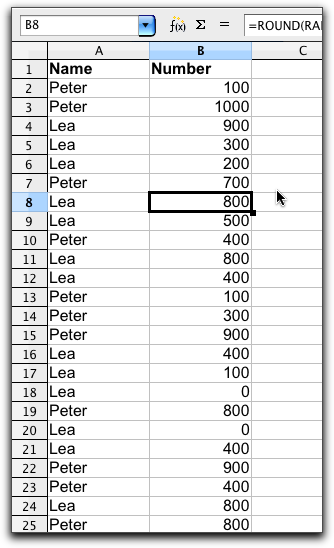
This image shows a large amount of data...
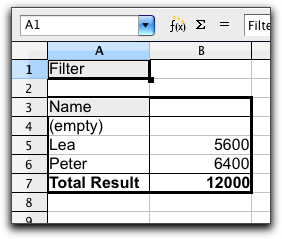
...while this image shows how neatly it can be summarized and presented with a DataPilot.
Meet the data
This is the data weíre going to work with.
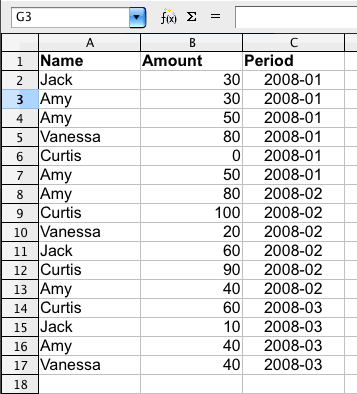
As you can see, it’s a relatively short list, but already getting pretty messy. We’ll try to change that here.
Here’s what to do:
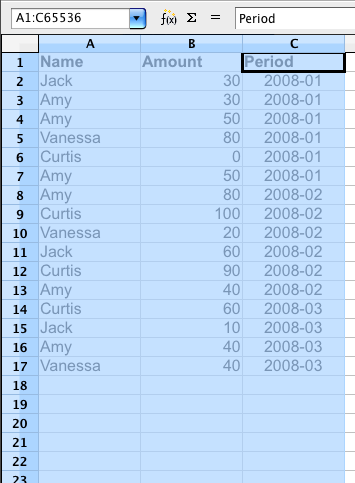
Mark the data as shown above by clicking the column headers A through C.
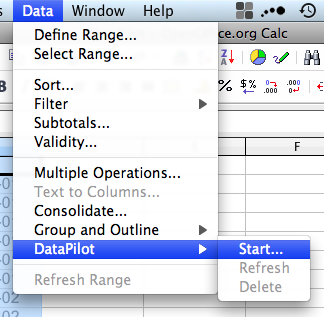
Go to the menu: Data -- DataPilot -- Start
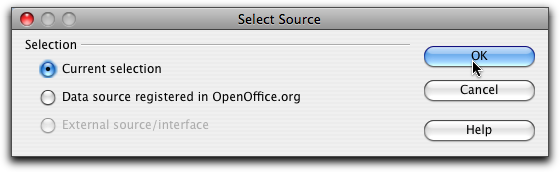
Select Current selection and hit [OK].
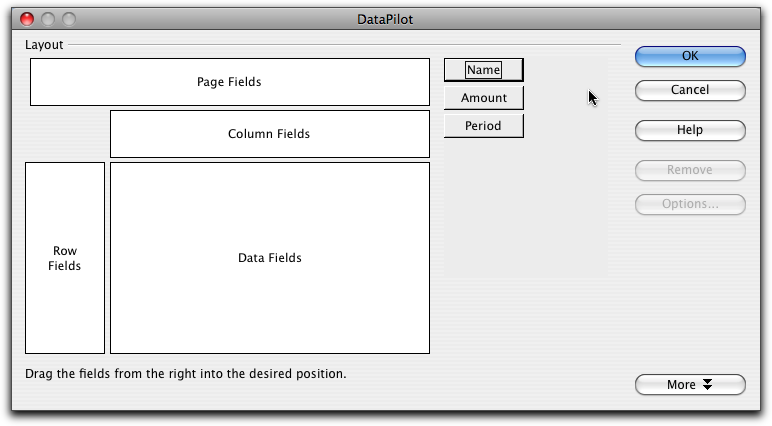
Drag the box titled [Name] to the area called Row Fields and drop it.
Drag the box titled [Period] to the area called Column Fields and drop it.
Drag the box titled [Amount] to the area called Data Fields and drop it.
Now double click the box titled [Amount] and check that the next dialogue box says "Sum", and hit [OK].
Click [More]. This is where you select where you want the table to appear. Choose "-new sheet-" from the Results to-menu.
Now hit [OK].
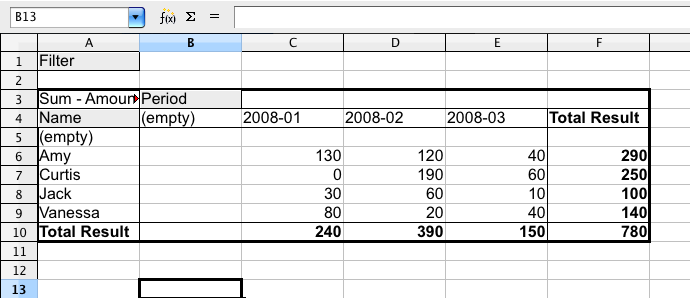
You should now have a table that looks pretty much like the one above.
The grey cells called [Period] and [Name] can be moved from the left side to the top or the other way around. Try that, and see what happens!
Instead of showing all the periods at once, we now want to display only one period at a time. There are two good ways of accomplishing that.
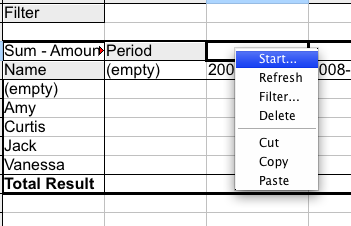
The first one: Right click anywhere inside the DataPilot table, and choose "Start...". Drag [Period] from the Column Fields-area and drop it on the Page Fields area. Hit [OK]. It should now show the total of all periods instead of the previous split. If you go to the menu at [Period], you can choose different periods, i.e. 2008-01 -- try that and see what happens!
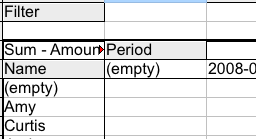
The other way of moving from field to field, is simply by dragging the fields from one area to another inside the spreadsheet! Try this by click and drag [Period] and drop it on top of [Filter] at the top of the spreadsheet. Easy, huh? If you have 10 000 lines of data, itís still as easy as this! "Who will ever use 10 000 lines of data in real life?!?" Well, I do, actually. Quite often, as a matter of fact. So do quite a few of my colleagues.
You can add more data to the table at any time, because when we created the DataPilot, we selected the entire rows, not just limited to certain cells. To add more data, you simply enter the data at the bottom of the data set, go back to the DataPilot, right-click and select [Refresh]. This last bit is very important, as the DataPilot wonít update itself. This might seem odd, but it really makes sense, because the spreadsheet would become extremely sluggish if it had to update the DataPilot for each item that changed in the data table.
The next step is now to play with this as much as possible, and try to discover different uses for the DataPilot! Iím sure that a lot of the ways I use the DataPilot was never intended by the developers, but because itís so flexible, you can use it in so many ways.
I’ll give you a few hints; DataPilots are a perfect match for =LEN(), =LEFT(), =RIGHT(), =MID(), =RIGHT() and =VLOOKUP() ;-)